Some say Android is very much like iOS but as long as Android remains open, even as much as it is now it will never be remotely similar. Perhaps in terms of the look and feel but Android will always be ahead in terms of functionality. Whether it’s useful or not will always depend on the kind of user you are. For instance, not many are bothered about the CPU and GPU usage and RAM statistics on their phones. Yet, if you do want to know, there are many apps that’ll tell you that on Android and iOS as well. With Android though, you can monitor CPU and GPU usage in real-time, all the time, right on your screen.
That’s because Android will let you give certain apps the permission to run on top of other apps. It’s a permission that can be misused, so you’d have to be careful when you allow an app such permission. The app we’re featuring today is called Profiler and it works on any Android devices running Android 4.0 and above. It displays a translucent grid window above anything on your screen displaying graphs for representing CPU and GPU usage.
Profiler
[googleplay url=”https://play.google.com/store/apps/details?id=cz.chladek.profiler”]Profiler is a light-weight Android app that lets you monitor your device’s CPU and GPU usage in real time. Not only that, but you can also monitor your device’s RAM, battery voltage, temperature, current, and network traffic. The advantage it gives you is that it provides an overlay above any apps on your screen. This allows you to monitor resource usage per app as you use your device. It’s only a few kilobytes in size too.
Features
- Allows visualizing different stats, including CPU and GPU, as charts
- Allows for full customization of those charts, including color
- Small application size – around 103kb
- Includes a floating window for displaying your stats over any app.
Monitor CPU and GPU Usage with Profiler
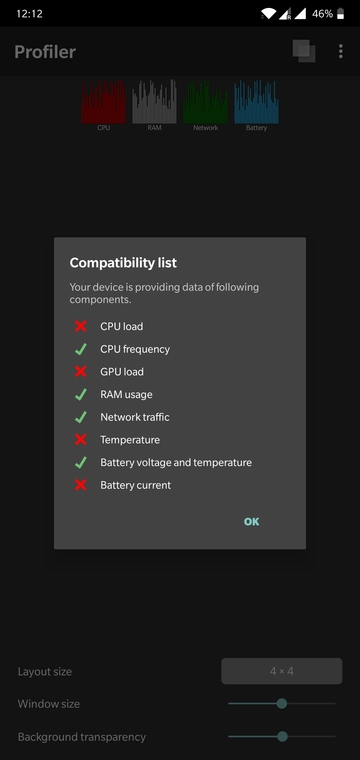
Not every device will support all of the features though because what a device allows the app to see depends heavily on the kernel. When you launch the app, it checks out for all the things it can display and lets you know. The developer has even gone through the trouble of creating a huge compatibility list that you can check out here: Profiler Device Compatibility List. The link is also available within the app menu.
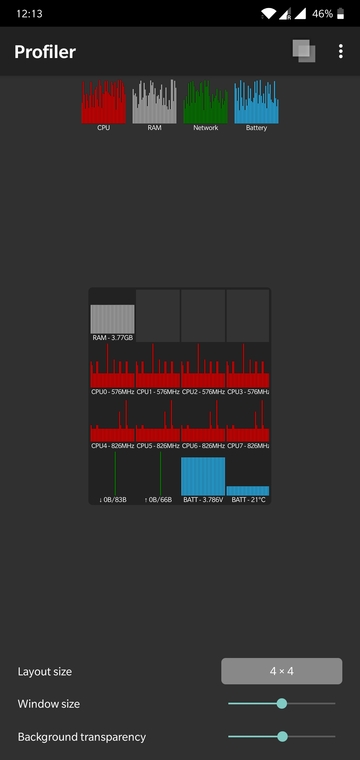
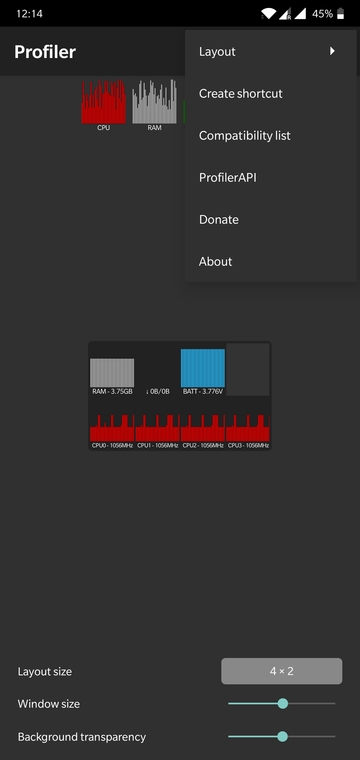
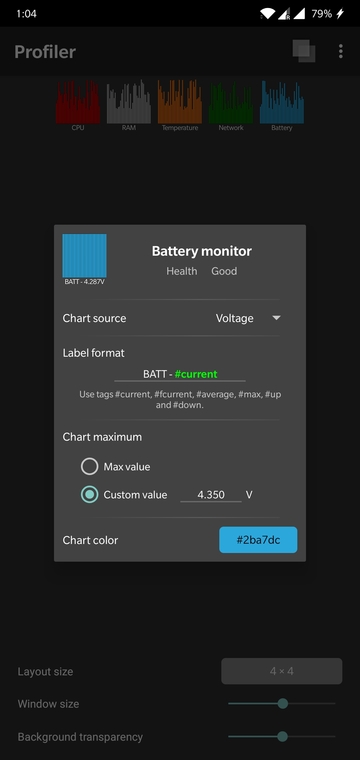
On the app’s main page you can see a default layout that displays everything that the app can display on your device. You can change the layout grid, window size, and translucency from the options provided at the bottom. You can drag and drop any of the available options like CPU, RAM, Network, etc. onto a grid from above.
The customization doesn’t stop there though. You can still tap on each individual tile or grid and select a few properties based on the kind of information it displays. For instance, tapping on a CPU grid will allow you to select the CPU core for which it displays the information for, among other things.
Enable Profiler Overlay
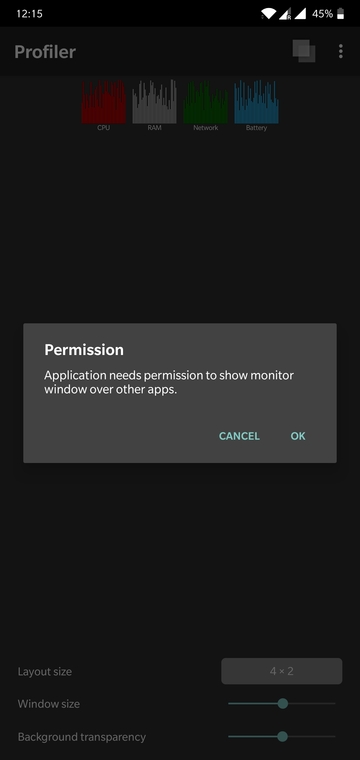
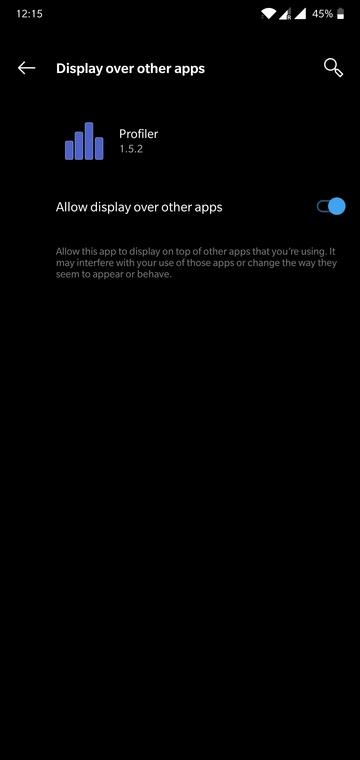
When you want to enable the CPU and GPU usage monitoring overlay so that your translucent usage monitor window can be seen over other apps, tap on the double square icon at the top. At this point, you’ll have to grant the app the permission to Display over other apps. It’s kind of obvious why it would need the said permission. When you tap OK on the pop-up dialog it redirects you to your device’s settings page where you can turn on the toggle for the required permission.

Once you do, you can exit the app and move around the window to a part of your screen where it is the least obstructing. The window will now be present on top of anything you open as long as you don’t go back into the app and tap on the double square icon again to turn it off.


Join The Discussion: